Hi everyone! Happy January, and welcome to our latest Market Update video where we explain what’s happening throughout the greater DC Metro real estate market (that is, DC, MD and VA) so you can make informed real estate decisions. We are in a very interesting market right now. We’re going to share some national and local data, and then I will be back to put it all together.
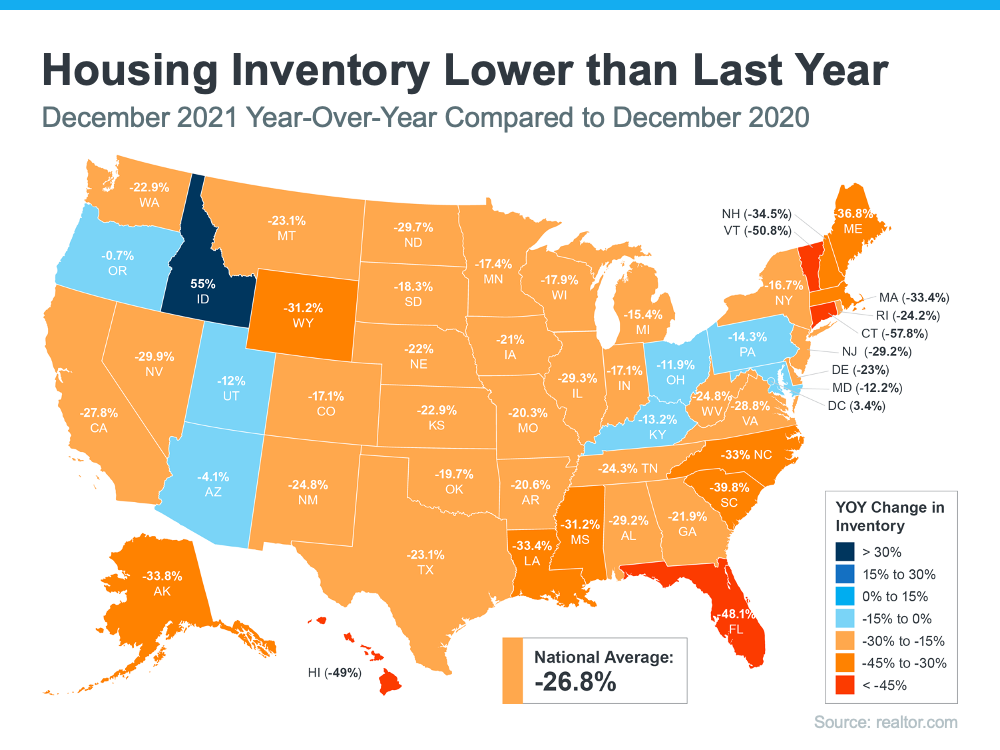
Let’s start with housing inventory, which is currently at a record low throughout the US. Here you can see the changes in inventory year over year and almost every stat is in the double digits.

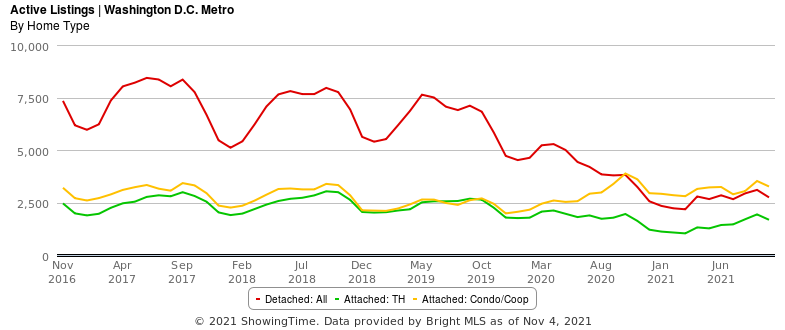
Locally, it’s no different. In this 10 year trend, you can see that we average around 7500 single homes for sale at any given time through the entire DC Metro area, but today we are around 1,500. 80% lower than normal.
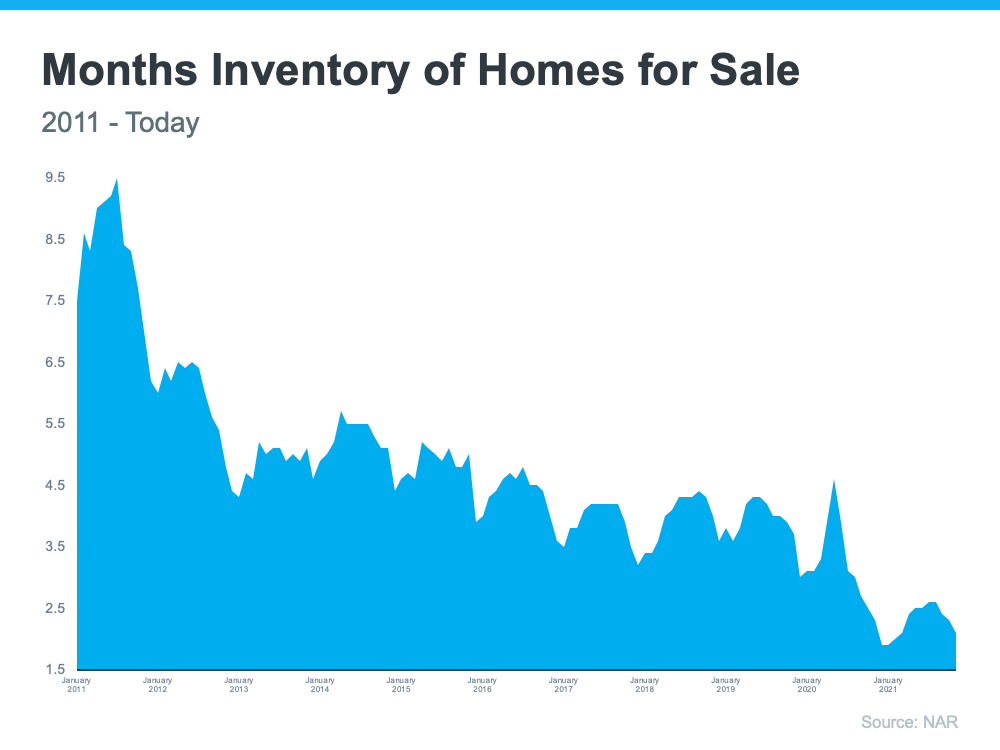
Throughout the US, we see that we have about 2.1 months of inventory. For reference, we need 3-6 months for a stable market. Anything under 3 months is a seller’s market and over 6 months is a buyer’s market.
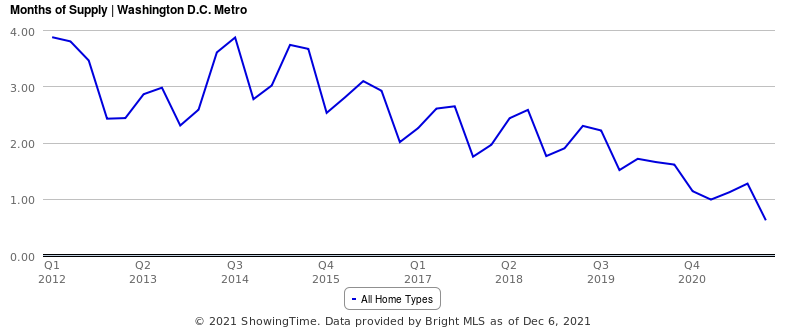
Locally, we are actually under one month of inventory, creating an exceptionally strong sellers market and making it extremely competitive if you are a buyer.
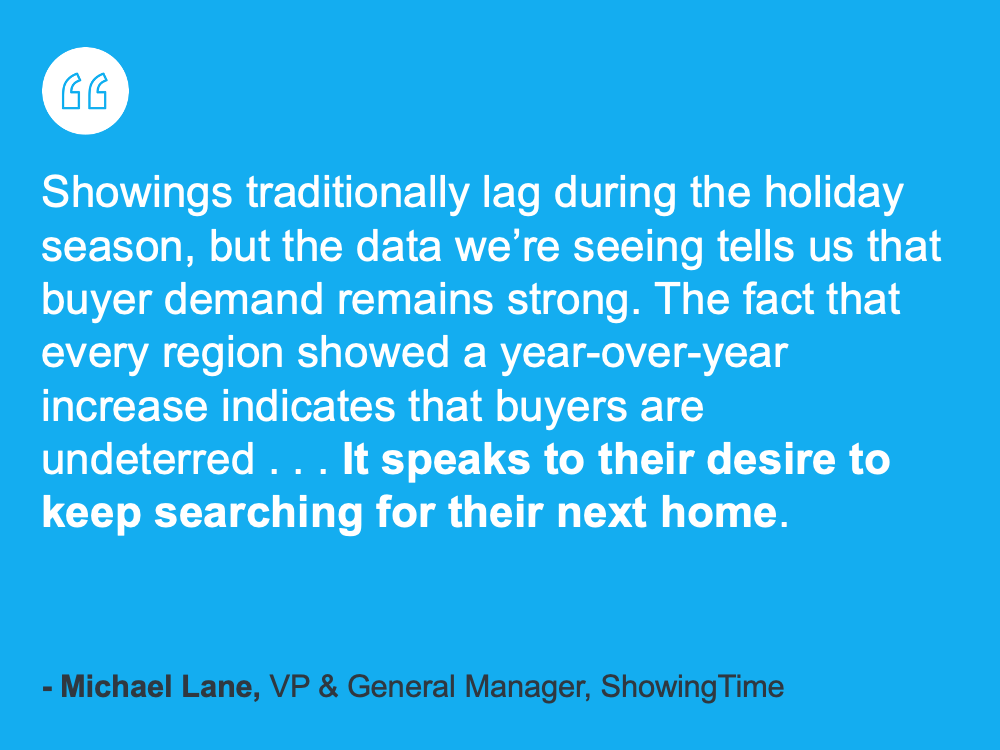
During December and January, the market usually cools off a little. However, buyer demand remains strong this year, as indicated by Michael Lane who oversees Showingtime, the scheduling service that most MLS’s use to coordinate agent showings.
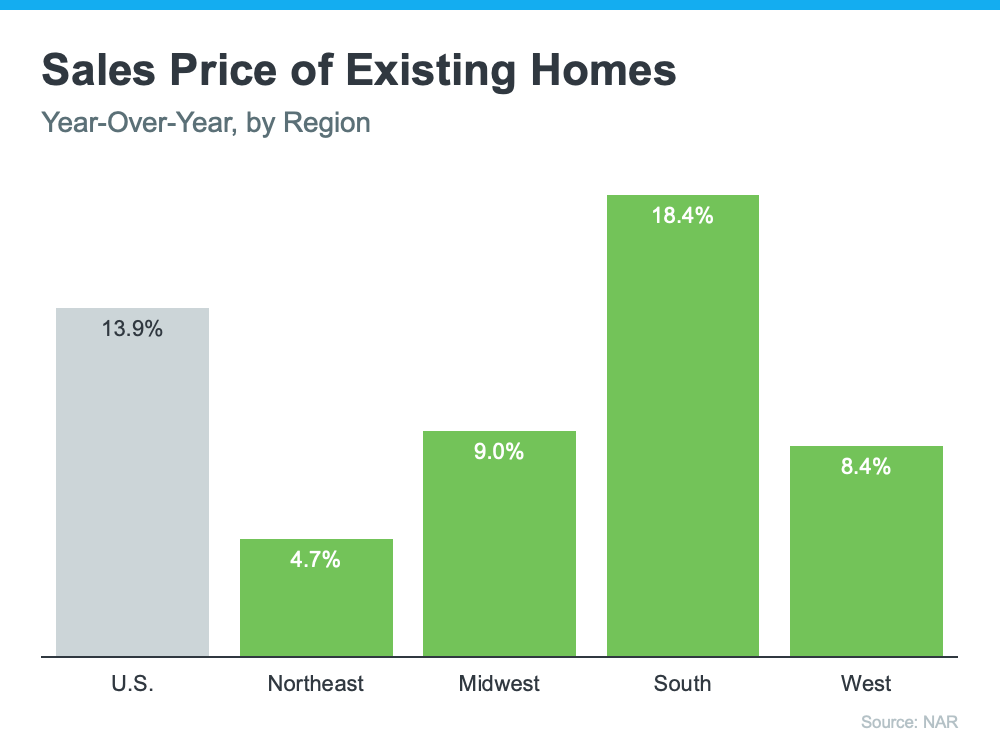
So, that strong demand and low supply has caused prices to rise. Interestingly, the “south region” saw some of the greatest gains at an 18% increase year over year in 2021. We think this is likely because housing is generally more affordable down south and people wanted to be outside in warmer weather due to the pandemic.
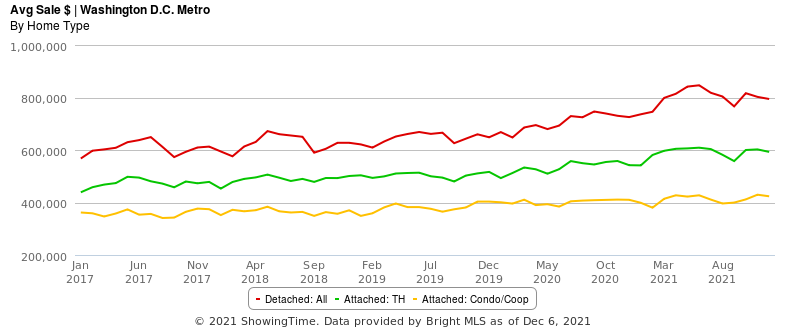
Locally, prices have increased as well. The average sales price of a single family home has gone from $580K in 2017 to $800K at the end of of 2021—a 37% increase in 5 years! While the average prices have bounced off the highs from last summer, remember these are averages. We haven’t seen any prices for comparable homes decrease, so the decrease may be due to a cooling off of the market and a decrease of max escalations in competitive offers.
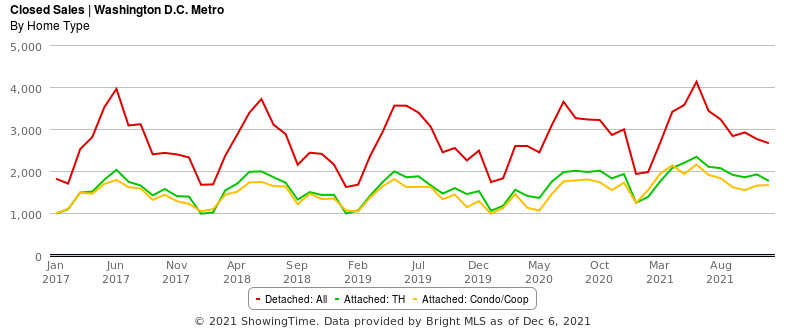
So, if there are less homes for sale, you might be thinking that there are less homes SELLING–but this is a common misunderstanding. 2021 actually hit a record of 80,000 homes sold, beating the previous record of 70,000 homes sold in 2020 by 10,000 homes! Prior to that, we had never been above 67,000 homes sold in a year. The reason there are less homes for sale is because they sell so quickly.
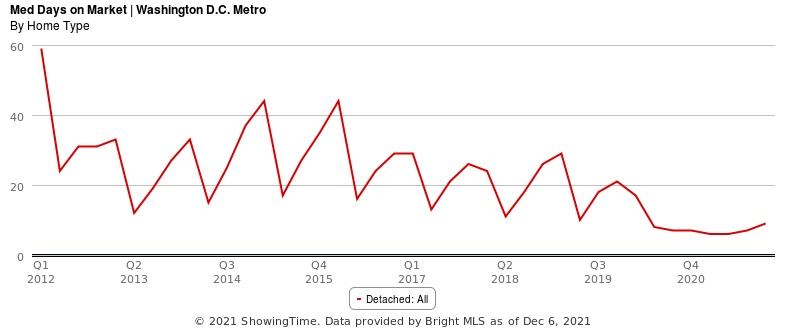
Take a look at this chart that shows that the median days on market for a home has been around 25 for the past 10 years — but this year it was 9!
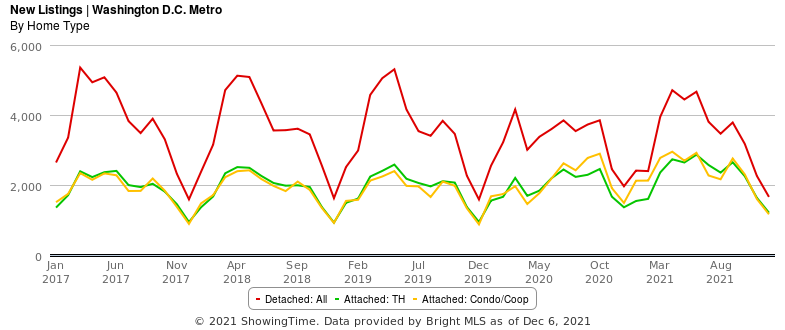
The bottom line is that we need more new homes coming on the market to meet demand. In 2021, we had 96,000 homes come on the market—the previous record was 90,000 in 2017. That’s good, but still not enough to meet the appetite of the current market.